5 Price Action Bar Patterns Every Trader Should Know
Price action bars show the open, high, low, and close for a given period (a day or an hour for example) and offer insights into market sentiment and probable future price movement. Understanding these patterns is vital for traders, as they serve as invaluable tools for decision-making.
This article will discuss five critical price action bar patterns that any trader should be familiar with offering invaluable stock option trading lessons for success in financial markets.
5 Crucial Price Action Bar Patterns
Price bar patterns are essential to traders as they provide insights into the sentiment of markets and possible future price moves. Below are five important patterns that every trader should know:
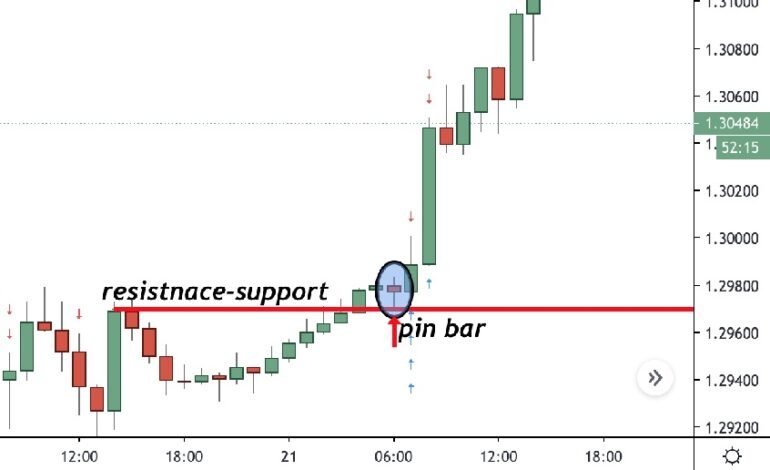
1. Pin Bar (Pinocchio Bar)
Pin bar or Pinocchio Bar is featured with a long wick and a small body that indicate the possibility of market reversal. A bullish pin bar results from the price declining but closing high which can be read as a sign of upward reversal.
A bearish pin bar, on the other hand, results from the price rising but closing lower showing a possible downward reversal.
This pattern reflects a rejection of a specific price level by market participants, offering traders insights into sentiment shifts and opportunities for strategic entry or exit points.
2. Engulfing Bar
An Engulfing Bar occurs when one candle’s body completely engulfs the previous candle’s body, suggesting a potential trend reversal. A bullish engulfing pattern forms when a smaller bearish candle is followed by a larger bullish one, indicating a potential upward reversal.
On the other hand, a bearish engulfing pattern forms when smaller bullish candles are trailed by larger bearish ones signaling an impending downward reversal.
For strategic trading purposes, most traders use this pattern to spot changes in market sentiment and anticipate future price movements.
3. Inside Bar
An Inside Bar occurs when the high and low of a candlestick are within the range of the previous candlestick, indicating consolidation and indecision in the market. It suggests that the market is taking a breather or pausing before potentially continuing its previous trend.
Traders often observe Inside Bars for potential breakouts waiting for clear moves beyond this range so as to confirm the next price move direction before taking any trade steps.
4. Outside Bar
The outside bar happens when the high and low of a candle are greater or lower than that of the previous one. It signifies a shift in market sentiment, with the potential for a reversal in the current trend.
A bullish outside bar forms when a candle’s high and low exceed those of the previous bearish candle, while a bearish outside bar forms when a candle’s high and low exceed those of the previous bullish candle.
5. Doji
A doji is a price bar candlestick pattern characterized by a small body and long wicks, indicating indecision and a potential reversal in the market. It forms when the opening and closing prices are virtually equal, resulting in a cross-like appearance.
A doji suggests that buyers and sellers are evenly matched, and it often occurs at key support or resistance levels.
Conclusion
Learning these five price action bar patterns can boost your trading abilities and earnings. By spotting these patterns and understanding what they mean, you can make smarter choices when trading. Practice makes perfect, so keep practicing to get better. If you want to learn more, check out the price action trading course on Upsurge.club.